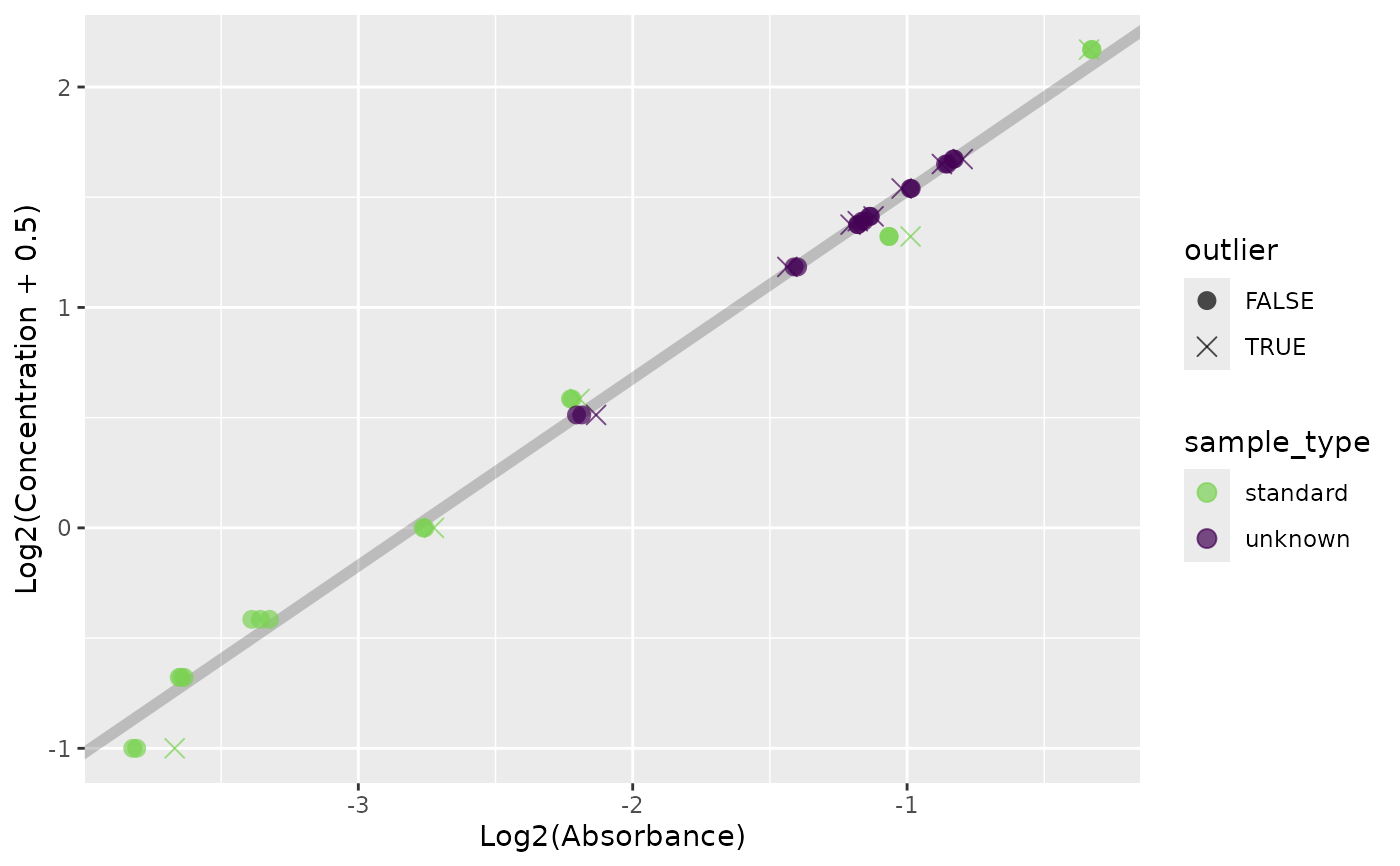
View an absorbance/concentration plot
Examples
absorbances |>
  qp() |>
  qp_plot_standards()
#> Warning: `sample_type` contains values other than `standard` and `unknown`
#> ! These values may be ignored downstream!
#> Warning: `sample_type` contains values other than `standard` and `unknown`
#> ! These values may be ignored downstream!