Plot a gp object
gp_plot.RdPlot a gp object
Usage
gp_plot(x, name = .sec, ...)

# S3 method for class 'gp'
gp_plot(x, name = .sec, ...)

# S3 method for class 'data.frame'
gp_plot(x, name = .sec, ...)
Arguments
- x
A
gpobject ordata.frame- name
Symbol. Name of a column in
gp$well_data(or a column in the data.frame if data.frame was supplied) to use as a color.- ...
Additional arguments to be passed to
ggplot2::geom_point()
Examples
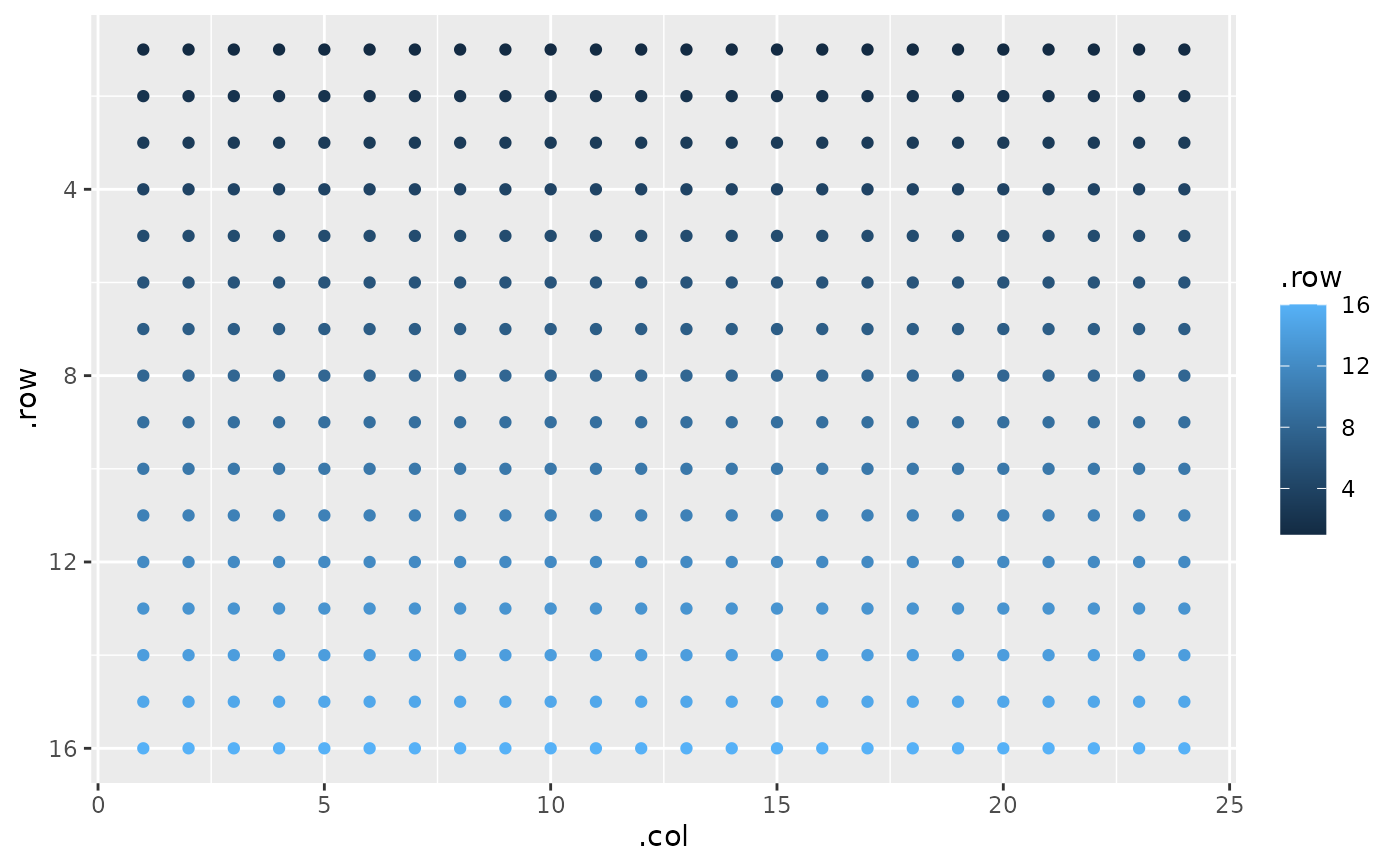
gp(16, 24) |> gp_plot(.row)