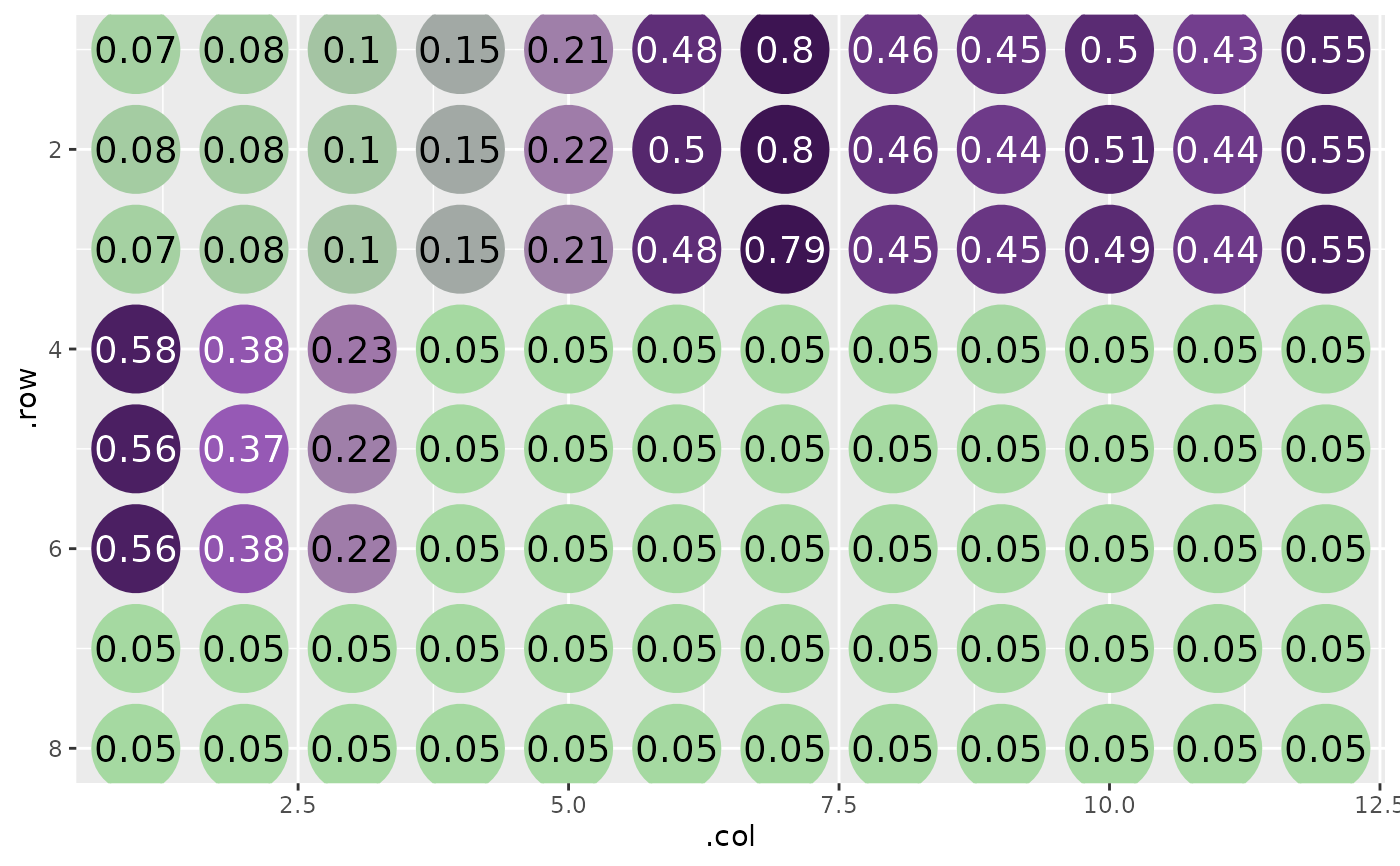
View the absorbances of an analyzed qp as they were on the plate
Source: R/qp_plot_plate.R
qp_plot_plate.RdView the absorbances of an analyzed qp as they were on the plate
qp as they were on the plateR/qp_plot_plate.R
qp_plot_plate.RdView the absorbances of an analyzed qp as they were on the plate